File:Lapse rates.png: Difference between revisions
Jump to navigation
Jump to search
imported>Milton Beychok (uploaded a new version of "Image:Lapse rates.png": {{Image_Details|user-pd |description = Diagram of the various atmospheric lapse rates |author = ~~~ |date-created = August 26, 2009 |pub-country = United States |notes = This is a smaller version of the diagram I uploaded a few days ago |versions = }}) |
(== Summary == Importing file) Tag: Server-side upload |
||
| (3 intermediate revisions by 2 users not shown) | |||
| Line 1: | Line 1: | ||
== Summary == | == Summary == | ||
Importing file | |||
Latest revision as of 19:55, 11 March 2022
Summary
Importing file
File history
Click on a date/time to view the file as it appeared at that time.
| Date/Time | Thumbnail | Dimensions | User | Comment | |
|---|---|---|---|---|---|
| current | 19:55, 11 March 2022 | 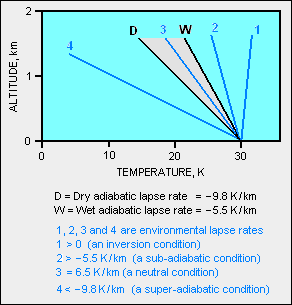 | 292 × 305 (8 KB) | Maintenance script (talk | contribs) | == Summary == Importing file |
You cannot overwrite this file.
File usage
The following 2 pages use this file: