Archive:New Draft of the Week
The New Draft of the Week is a chance to highlight a recently created Citizendium article that has just started down the road of becoming a Citizendium masterpiece.
It is chosen each week by vote in a manner similar to that of its sister project, the Article of the Week.
Add New Nominees Here
To add a new nominee or vote for an existing nominee, click edit for this section and follow the instructions
| Nominated article | Vote Score |
Supporters | Specialist supporters | Date created |
|---|---|---|---|---|
| Tall tale | 2 | Daniel Mietchen ; Howard C. Berkowitz ' |
9 March 2010 | |
| Plane (geometry) | 1 | Daniel Mietchen | Major rewrite on 29 March 2010 | |
If you want to see how these nominees will look on the CZ home page (if selected as a winner), scroll down a little bit.
Transclusion of the above nominees (to be done by an Administrator)
- Transclude each of the nominees in the above "Table of Nominee" as per the instructions at Template:Featured Article Candidate.
- Then add the transcluded article to the list in the next section below, using the {{Featured Article Candidate}} template.
View Current Transcluded Nominees (after they have been transcluded by an Administrator)
The next New Draft of the Week will be the article with the most votes at 1 AM UTC on Thursday, 15 April, 2010.
| Nominated article | Supporters | Specialist supporters | Dates | Score | |||||||||||||||||||||||||||||||||||||||||||||||||||||||||||||||||||||||||||||||||||||||||||||||||||||||||||||||||||||||||||||||||||||||||||
|---|---|---|---|---|---|---|---|---|---|---|---|---|---|---|---|---|---|---|---|---|---|---|---|---|---|---|---|---|---|---|---|---|---|---|---|---|---|---|---|---|---|---|---|---|---|---|---|---|---|---|---|---|---|---|---|---|---|---|---|---|---|---|---|---|---|---|---|---|---|---|---|---|---|---|---|---|---|---|---|---|---|---|---|---|---|---|---|---|---|---|---|---|---|---|---|---|---|---|---|---|---|---|---|---|---|---|---|---|---|---|---|---|---|---|---|---|---|---|---|---|---|---|---|---|---|---|---|---|---|---|---|---|---|---|---|---|---|---|---|---|---|---|---|
 Steam is the vapor (gaseous) phase of water (H2O) usually generated by the boiling of water. When the steam does not contain any liquid water, it is known as dry steam and it is completely colorless. However, when the steam contains tiny droplets of condensed liquid water, it appears to the eye as a white cloud (see the steam being vented from a geothermal power plant in the adjacent photograph). What is very often referred to as smoke from cooling towers and other vents in industrial facilities is water vapor which has partially condensed and is mistaken to be white smoke. Water aerosols and mists, such as those created by spray cans for misting house plants or certain types of humidifiers, may also create small visible clouds of water droplets, but aerosols, mists and fogs are not steam. Liquids other than water may also form visible clouds when vaporized, but they are not clouds of steam. Steam is manufactured in industrial processes by the boiling and vaporization of liquid water. It also occurs naturally by being vented from volcanoes, fumaroles, geysers and other geothermal sources. Steam has a great many industrial and domestic uses. Probably the most important and by far the largest use of steam is in nuclear, fossil fuel and geothermal power plants. Types of steamAs shown in the adjacent diagram, there are three types of steam:
Referring to the adjacent drawing again, water is converted into wet, dry saturated or superheated steam in three steps:
ProductionWays of producing steam from water include use of boilers or steam generators. Boilers are pressure vessels in which water is heated to produce pressurized steam, for generally heating houses or buildings, for steam engines, or a variety of other uses. Steam generators are devices or units, often including boilers (the definitions coincide greatly), for producing (generating) steam for power plant, industrial, or other uses. The size of steam generators ranges from bench top to very large units or sections of a thermal power plant. In the field of nuclear power plants, the term steam generator refers specifically to a particular very large heat exchanger used to thermally connect the primary (reactor plant) system to a secondary (steam plant) system in a pressurized water reactor (PWR) plant, which generates steam for the steam plant, of course. UsesElectricity generationThe worldwide capacity of electrical power generation by conventional coal-fired power plants currently amounts to about 800,000 MW[1][2][3][4] and the worldwide capacity of nuclear power generation amounts to about 370,000 MW.[5][6] That amounts to a total of 1,170,000 MW of worldwide generation, most of which involves the use of superheated steam to drive the turbines that spin the electrical generators (see the adjacent schematic diagram).[7] Assuming an overall thermal efficiency of 34%, a steam generator (boiler) efficiency of 75 to 85% and an electrical generator efficiency of 98.5%, a conventional coal-fired power plant would use superheated steam at a rate of 3.47 to 3.93 (t/h) per MW of power output. Thus, a 1000 MW power plant would use 3,470 to 3,930 metric tons (tonnes) of steam per hour and the steam used by the 1,170,000 MW of worldwide power generation by coal-fired and nuclear power plants might be as much as 4,000,000 to 4,600,000 metric tons of steam per hour. The diagrams below schematically depict the equipment used in a conventional fuel-fired steam to electric power plant as well as the temperature-entropy (T-S) diagram of the corresponding Rankine cycle. A nuclear power plant differs only to the extent that the heat required by the boiler is provided by heat derived from a nuclear reactor. Cogeneration of heat and powerCogeneration is also referred to as combined heat and power or CHP. In electrical power generation, the turbine exhaust steam is typically condensed and returned to the boiler for re-use. However, in one form of cogeneration, all or part of the turbine exhaust steam is distributed through a district heating system to heat buildings rather than being condensed. The world's biggest steam cogeneration system is the district heating system which distributes steam from seven cogeneration plants to provide heating for 100,000 buildings in the city of New York.[8][9] Steam enginesAs an overall definition, a steam engine is an engine that uses steam to perform mechanical work. By that definition, steam turbines are steam engines. However, this section describes steam engines that use the expansion of steam to move a piston that performs work. Such steam engines were the driving force behind the Industrial Revolution of the 18th century and gained widespread commercial use for driving machinery in factories, powering water pumping stations and transport application such as railway locomotives, steamships and road vehicles. The use of tractors driven by steam engines led to an increase in the land available for agricultural cultivation. Although largely replaced by steam turbines, stationary reciprocating steam engines are still used in industry and elsewhere for driving pumps, gas compressors and other types of machinery. Uses in industrial process facilitiesA great many processes in petroleum refineries, natural gas processing plants, petrochemical plants and other industrial facilities use steam as:
Other uses
Steam tables and Mollier diagramsSteam tables provide tabulated thermodynamic data for the liquid and vapor phases of water. The table below is only an example of the type of data provided. In a complete set of steam tables, the table would provide data in temperature increments of 1 °C. The complete steam tables would also provide a similar "Saturated Steam:Pressure Table" in which the first column would have pressure values and the second column would be temperature values. Most steam tables include tabulated thermodynamic data for superheated steam as well.
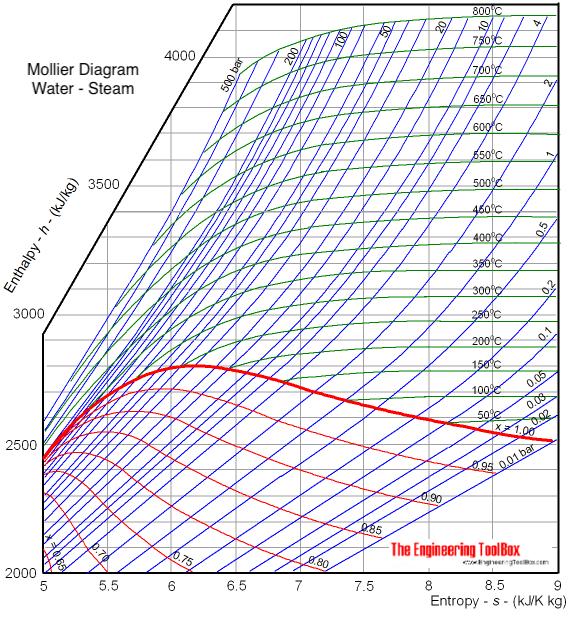
Mollier diagrams are graphical representations of the thermodynamic properties of materials involving "Enthalpy" as one of the coordinates. Mollier diagrams are named after Richard Mollier (1863 - 1935), a professor at Dresden University in Germany, who pioneered the graphical display of the relationship of temperature, pressure, enthalpy, entropy and volume of steam (as well as for moist air) that has aided in the teaching of thermodynamics to many generations of engineers. His enthalpy-entropy (H-S) diagram for steam was first published in 1904.[11][12] Mollier diagrams are routinely used to visualize the working cycles of thermodynamic systems involved with the chemical engineering process design of power plants (fossil or nuclear), gas compressors, steam turbines, refrigeration systems and air conditioning. A sample Mollier diagram for steam is presented below and others are available online:[13][14][15] References
|
Meg Ireland | Milton Beychok; Howard C. Berkowitz | 5
| ||||||||||||||||||||||||||||||||||||||||||||||||||||||||||||||||||||||||||||||||||||||||||||||||||||||||||||||||||||||||||||||||||||||||||||


Current Winner (to be selected and implemented by an Administrator)
To change, click edit and follow the instructions, or see documentation at {{Featured Article}}.
| The metadata subpage is missing. You can start it via filling in this form or by following the instructions that come up after clicking on the [show] link to the right. | |||
|---|---|---|---|
|
Higher mathematics in pre-modern Japan, also known as wasan (和算), flourished during the Edo period from the early 17th to the late 19th centuries. It had its origins in the Chinese mathematical texts which were acquired by the Japanese during their invasions of Korea in the late 16th century.[1] In a fairly isolated state, the Japanese mathematicians were able to make brilliant new discoveries in areas rarely attributed to a non-Western scholarship, sometimes outpacing their Western counterparts.[2]
Studies of Japanese mathematics were prompted by the introduction of Western mathematics to Japan and the subsequent decline of wasan during the latter half of the 19th century. Despite the steady increase in the number of articles published in Japanese since the 1920s, the subject remained at the backstage because of postwar-Japan’s scientific national policy. This changed in the recent years with the revisionist historians who have sought to contradict the Eurocentric historical views by reevaluating the non-Western sciences.[3] In this revisionist discourse, the centerpiece has often consisted of China and Japan, both of which defied the West’s totalitarian portrait of the Orient[4] by building vibrant economies and achieving comparable scientific advances before the mid-1800s.[5]
Mathematics during the Asuka and Nara periods

The oldest known case of mathematics in Japan was a system of exponential notation for high powers of ten, similar to the exponential law , which was in use before Jimmu’s legendary founding of Japan in the seventh century BCE. Findings on the subsequent cases of mathematics in ancient Japan come from the 6th century CE and afterwards when Buddhism was introduced from Korea. During the reign of Empress Suiko, the Chinese chronological system was made known, books on astrology and the calendar were introduced, and the first almanacs came into use. Prince Shotoku was so engaged in these learnings that he was honored as the father of Japanese mathematics. Emperor Tenchi, who ruled from 668 to 671 CE, created a water clock and defined the length of a day as one hundred hours. Around this time, a school of arithmetic and an observatory were also established. In 701, Emperor Monbu established a university system that included mathematical studies based on nine Chinese texts.[6] The most important among them concerned algebra, which enabled the creation of the department of “Arithmetic Intelligence” responsible for land survey and tax collection in 718. Calculations of the period were done with small bamboo sticks known as sangi, which were arranged differently like the Roman numerals to represent different numbers and were placed on paper with prescribed operations.[7]

After this brief period of enthusiasm and progress, Japanese mathematics unfortunately stagnated and stalled for nine hundred years. The nine Chinese texts were eventually forgotten, and mathematics in Japan degenerated into a superstitious body of knowledge that concerned puzzles and fortune telling. It was said that the knowledge of division was lost except in some religious establishments where calendar manuscripts were found.[8] During the Kamakura and the Muromachi periods, occasional references to sangi indicate that its use continued, but no new developments materialized.[9]
Wasan during the Edo period

The Dark Age for Japanese mathematics ended with Toyotomi Hideyoshi’s invasion of Korea in 1592. A soldier was able to return to the port of Hakata with a Chinese abacus, which existed in China since the 1200s and became known as soroban in Japanese.[10] Its use became widespread after Mori Shigeyoshi published an introductory text regarding the abacus in 1622, although it did not completely replace the sangi that was more convenient for complex algebraic operations.[11] A more extensive text, and also the first complete mathematics book in Japan, was published under the title, Jinkoki, or Large and Small Numbers, in 1627 by Yoshida Mitsuyoshi. It was based on a famous Chinese text that was published in 1593 and dealt mostly with methods of computations such as multiplication, division, and the extraction of square and cube roots on the abacus.[12] Yoshida published at least six new editions of the Jinkoki, and among them the 1641 edition was the beginning of idai,[1] in which open problems are presented to the readers at the end of the book.[13]

After this initial takeoff, Japanese mathematics steadily progressed, primarily in areas of geometry and number theory,[14] within an open intellectual dialogue that was initially facilitated and proliferated by the samurai class. At the onset, mathematics was mostly pursued by the samurais as it had military application in surveying, navigation, and calendar making.[15] As the samurais came to work as civil servants with modest stipends, they also taught reading, writing, and arithmetic in small private schools called juku, which comprised much of the educational system in pre-modern Japan. Because of the low attendance fees, juku’s were widely attended by members across all ages and economic strata, and consequently mathematics became widely accessible within the Japanese society. People who could not afford to publish their own books posted their new findings on wooden prayer tablets in temples as offering to the gods. These tablets, which became known as sangaku, allowed the Japanese mathematicians to exchange ideas and identify new problems and thus transformed the temples into intellectual forums facilitating a nationwide dialogue. This open and collaborative discourse also existed in publications through the practice of idai, and it accelerated advances in Japanese mathematics, which took tangible form as wasan by the end of the seventeenth century.[16]
How wasan was expressed
|
Example of mathematical notations in wasan: The number of vertical lines represent the coefficient; for example, "||" means "". 長 is designated as ; 短, ; and 中, . 巾 means , and 勾 means "/". |


How was wasan expressed and solved? It was written vertically in Kanbun, or classical Chinese, that served a similar role in East Asia as Latin in medieval Europe as the written language of higher culture.[17] Because there were only few symbols involved, more complicated equations had to be accompanied by sentences.[18] The traditional Japanese mathematicians did not discriminate between the rational and the irrational numbers, since they did not convert into decimals. This meant that, unlike their Western contemporaries,[19] the Japanese did not automatically assume π to consist of repeating decimals. It is also important to note that there was no concept of the Cartesian plane in wasan, which limited the understanding differential calculus for the Japanese.[20]
Types of problems
In the beginning, wasan included problems dealing with practical concerns, such as the calendar, which stimulated some of the most important findings in the studies of curves.[21] Yoshida introduced the challenge of calculating the value of pi as an idai problem in a later edition of his Jinkoki’s. The first to solve the problem was Muramatsu Shigekiyo, who wrote in 1663 that π = 3.14195264877.[22] He used the same technique that was used by Archimedes nineteen hundred years earlier, in which the value of pi is approximated on a regular polygon with a very large number of sides (in Muramatsu’s case, 32,768). Seki Takakazu, Japan’s most celebrated mathematician, calculated a much more accurate value of pi to be 355/113, which was correct to the eleventh digit.[23] He first used Muramatsu’s method to calculate the perimeters of three polygons with 215, 216, and 217 sides respectively. Then he posited that the perimeter of an infinite-sided polygon, a.k.a. the circle, is the sum of a geometric series ( a + ar + ar2 + ar3…), which equals to a/(1 - r) with infinite number of terms:
P(∞) = P(15) + a/(1-r) = P(16) + a1 a2 /( a1 - a2 ) = P(16) +[ P(16) - P(15) ][ P(17) - P(16) ] /{[ P(16) - P(15) ] - [ P(17) - P(16) ]}

He let a1 equal the difference in the perimeters of 215 and 216-sided polygons, a2 equal the difference in the perimeters of 216 and 217-sided polygons, and r equal the ratio of the differences, a2 and a1.
Seki evidently took great interest in the number theory, as his other achievements include discovering the theory of determinants, the Bernoulli numbers, and Horner’s method for extracting irrational roots before the European mathematicians who are given credit for originating them.[24] He also devoted one of his seven books to the magic squares.

In one example, Seki drew a filled 3 by 3 square and a blank 7 by 7 (which is 2n + 1, in which n = 3) square. Then he started numbering to the right from the cell to the left of the upper right-hand corner until he reached n (in this case, number 3). Then he numbered left from the cell left of 1 until he reached the 2n-1 (in this case, number 5). Then he numbered down the right side to the cell preceding the lower right-hand one. Then he numbered along the top row until he reached the upper left-hand corner. Then he filled the left-hand column and the bottom row by subtracting from (2n + 1)2 + 1 the respective numbers on the opposite side. Then he switched n (in this case, 3) figures to the left of the upper right-hand corner with the corresponding ones in the lower row, and likewise for the n figures above the lower right hand corner, resulting in a square shown in fig. 11. Finally he filled the inner cells by repeating the procedure with number 13, resulting in the square shown in fig. 12, which includes all numbers from 1 to 49, which paired at opposite ends equal to 50 (11 + 39 = 50 ; 34 + 16 = 50 ; 12 + 38 = 50), and features consecutive patterns at intervals of 3 (10, 11, 12; 23, 25, 27; 43, 42, 41; 8, 18, 28; 24, 34, 44..).[25]
Outside the published works, Japanese mathematics was usually limited to geometry problems that were found on the sangaku tablets. Geometry problems sometimes concerned beautiful arrangement of shapes, such as a fan, and solving them were considered as a type of art in itself.[21] Some geometric problems related to more practical concerns of architecture and woodcraft. One such case involved the lotus decorations of the Japanese temples from the Asuka and the Nara periods (538-794). As the lotus fruits were usually arranged in densest packaging within the receptacle, a practical artistic concern was the densest packing of circles within circles. The Japanese may also have had an interest in the densest packing problems because they addressed the practical issues of economical cutting and arrangement of objects.[26] Geometry problems continued to evolve in more complex forms, until they eventually involved intersecting solids and surface areas.[27]
Wasan's decline and conclusion
Despite its substantial achievements, mathematics in Japan never led to a discovery of mechanical or physical laws as it has in the West. This was partly because mathematics was considered as more of a recreational art rather than science. The Japanese mathematicians also refused to denigrate their works as those of the artisans by solving problems relating to practical issues. Instead they focused on abstract problems, which made inevitable the displacement of wasan by western mathematics by the late Tokugawa period.[28]
notes
- ↑ 1.0 1.1 Okumura, 2009. pp. 79
- ↑ Ruttkay, 2008. pp. 1
- ↑ Ogawa, 2001.pp. 146-147
- ↑ Hobson, 2004. pp. 226
- ↑ Hanley, 1999. pp. 13
- ↑ Smith and Mikami, 1914. pp. 4-9
- ↑ Hideotshi and Rothman, 2008. pp. 10-12
- ↑ Smith and Mikami, 1914. pp. 14-15
- ↑ Hideotshi and Rothman, 2008. pp. 14
- ↑ Palmer
- ↑ Hideotshi and Rothman, 2008. pp. 19
- ↑ Smith and Mikami, 1914. pp. 38
- ↑ Hideotshi and Rothman, 2008. pp. 13-16
- ↑ Okumura, 2009. pp. 80
- ↑ Bartholomew, 1989. pp. 21
- ↑ Hideotshi and Rothman, 2008. pp. 19-21
- ↑ Hideotshi and Rothman, 2008. pp. 9
- ↑ Ogawa, 2001.pp. 140
- ↑ Hideotshi and Rothman, 2008. pp. 75
- ↑ Morimoto, 2009. pp. 132-133
- ↑ 21.0 21.1 Ogawa, 2001.pp. 145
- ↑ "Japanese mathematics in the Edo period (1600-1868) (Science networks. Historical studies)." Lavoisier Librairie. Web. 07 Dec. 2009. <http://www.lavoisier.fr>.
- ↑ Hideotshi and Rothman, 2008. pp. 16
- ↑ Hideotshi and Rothman, 2008. pp. 69-71
- ↑ Smith and Mikami, 1914. pp. 116-118
- ↑ Tarnai and Miyazaki, 2003. pp. 145-149
- ↑ Okumura, 2009. pp. 81
- ↑ Ravina, 1993. pp. 205-207
Previous Winners
 Wasan [r]: Classical Japanese mathematics that flourished during the Edo Period from the 17th to mid-19th centuries. [e]
- Racism in Australia [r]: The history of racism and restrictive immigration policies in the Commonwealth of Australia. [e]
- Think tank [r]: Add brief definition or description
- Les Paul [r]: (9 June 1915 – 13 August 2009) American innovator, inventor, musician and songwriter, who was notably a pioneer in the development of the solid-body electric guitar. [e]
- Zionism [r]: The ideology that Jews should form a Jewish state in what is traced as the Biblical area of Palestine; there are many interpretations, including the boundaries of such a state and its criteria for citizenship [e] (September 3)
 Earth's atmosphere [r]: An envelope of gas that surrounds the Earth and extends from the Earth's surface out thousands of kilometres, becoming increasingly thinner (less dense) with distance but always held in place by Earth's gravitational pull. [e] (August 27)
- Joshua Lawrence Chamberlain [r]: U.S. educator deeply bonded to Bowdoin College, from undergraduate to President; American Civil War general and recipient of the Medal of Honor; Governor of Maine [e] (August 20)
- The Sporting Life (album) [r]: A 1994 studio album recorded by Diamanda Galás and John Paul Jones. [e] (August 13}
- The Rolling Stones [r]: Famous and influential English blues rock group formed in 1962, known for their albums Let It Bleed and Sticky Fingers, and songs '(I Can't Get No) Satisfaction' and 'Start Me Up'. [e] (August 5)
- Euler angles [r]: three rotation angles that describe any rotation of a 3-dimensional object. [e] (July 30)
- Chester Nimitz [r]: United States Navy admiral (1885-1966) who was Commander in Chief, Pacific and Pacific Ocean Areas in World War II [e] (July 23)
- Heat [r]: A form of energy that flows spontaneously from hotter to colder bodies that are in thermal contact. [e] (July 16)
- Continuum hypothesis [r]: A statement about the size of the continuum, i.e., the number of elements in the set of real numbers. [e] (July 9)
- Hawaiian alphabet [r]: The form of writing used in the Hawaiian Language [e] (July 2)
- Now and Zen [r]: A 1988 studio album recorded by Robert Plant, with guest contributions from Jimmy Page. [e] (June 25)
- Wrench (tool) [r]: A fastening tool used to tighten or loosen threaded fasteners, with one end that makes firm contact with flat surfaces of the fastener, and the other end providing a means of applying force [e] (June 18)
- Air preheater [r]: A general term to describe any device designed to preheat the combustion air used in a fuel-burning furnace for the purpose of increasing the thermal efficiency of the furnace. [e] (June 11)
- 2009 H1N1 influenza virus [r]: A contagious influenza A virus discovered in April 2009, commonly known as swine flu. [e] (June 4)
 Gasoline [r]: A fuel for spark-ignited internal combustion engines derived from petroleum crude oil. [e] (21 May)
- John Brock [r]: Fictional British secret agent who starred in three 1960s thrillers by Desmond Skirrow. [e] (8 May)
- McGuffey Readers [r]: A set of highly influential school textbooks used in the 19th and early 20th centuries in the elementary grades in the United States. [e] (14 Apr)
- Vector rotation [r]: Process of rotating one unit vector into a second unit vector. [e] (7 Apr)
- Leptin [r]: Hormone secreted by adipocytes that regulates appetite. [e] (31 Mar)
- Kansas v. Crane [r]: A 2002 decision of the Supreme Court of the United States, ruling that a person could not be adjudicated a sexual predator and put in indefinite medical confinement, purely on assessment of an emotional disorder, but such action required proof of a likelihood of uncontrollable impulse presenting a clear and present danger. [e] (24 Mar)
- Punch card [r]: A term for cards used for storing information. Herman Hollerith is credited with the invention of the media for storing information from the United States Census of 1890. [e] (17 Mar)
- Jass–Belote card games [r]: A group of trick-taking card games in which the Jack and Nine of trumps are the highest trumps. [e] (10 Mar)
- Leptotes (orchid) [r]: Add brief definition or description (3 Mar)
- Worm (computers) [r]: Add brief definition or description (24 Feb)
- Joseph Black [r]: Add brief definition or description (11 Feb 2009)
- Sympathetic magic [r]: Add brief definition or description (17 Jan 2009)
- Dien Bien Phu [r]: Add brief definition or description (25 Dec)
- Blade Runner [r]: Add brief definition or description (25 Nov)
- Piquet [r]: Add brief definition or description (18 Nov)
- Crash of 2008 [r]: Add brief definition or description (23 Oct)
- Information Management [r]: Add brief definition or description (31 Aug)
- Battle of Gettysburg [r]: Add brief definition or description (8 July)
- Drugs banned from the Olympics [r]: Add brief definition or description (1 July)
- Sea glass [r]: Add brief definition or description (24 June)
- Dazed and Confused (Led Zeppelin song) [r]: Add brief definition or description (17 June)
- Hirohito [r]: Add brief definition or description (10 June)
- Henry Kissinger [r]: Add brief definition or description (3 June)
- Palatalization [r]: Add brief definition or description (27 May)
- Intelligence on the Korean War [r]: Add brief definition or description (20 May)
- Trinity United Church of Christ, Chicago [r]: Add brief definition or description (13 May)
- BIOS [r]: Add brief definition or description (6 May)
- Miniature Fox Terrier [r]: Add brief definition or description (23 April)
- Joseph II [r]: Add brief definition or description (15 Apr)
- British and American English [r]: Add brief definition or description (7 Apr)
- Count Rumford [r]: Add brief definition or description (1 April)
- Whale meat [r]: Add brief definition or description (25 March)
- Naval guns [r]: Add brief definition or description (18 March)
- Sri Lanka [r]: Add brief definition or description (11 March)
- Led Zeppelin [r]: Add brief definition or description (4 March)
- Martin Luther [r]: Add brief definition or description (20 February)
- Cosmology [r]: Add brief definition or description (4 February)
- Ernest Rutherford [r]: Add brief definition or description(28 January)
- Edinburgh [r]: Add brief definition or description (21 January)
- Russian Revolution of 1905 [r]: Add brief definition or description (8 January 2008)
- Phosphorus [r]: Add brief definition or description (31 December)
- John Tyler [r]: Add brief definition or description (6 December)
- Banana [r]: Add brief definition or description (22 November)
- Augustin-Louis Cauchy [r]: Add brief definition or description (15 November)
- B-17 Flying Fortress (bomber) [r]: Add brief definition or description - 8 November 2007
- Red Sea Urchin [r]: Add brief definition or description - 1 November 2007
- Symphony [r]: Add brief definition or description - 25 October 2007
- Oxygen [r]: Add brief definition or description - 18 October 2007
- Origins and architecture of the Taj Mahal [r]: Add brief definition or description - 11 October 2007
- Fossilization (palaeontology) [r]: Add brief definition or description - 4 October 2007
- Cradle of Humankind [r]: Add brief definition or description - 27 September 2007
- John Adams [r]: Add brief definition or description - 20 September 2007
- Quakers [r]: Add brief definition or description - 13 September 2007
- Scarborough Castle [r]: Add brief definition or description - 6 September 2007
- Jane Addams [r]: Add brief definition or description - 30 August 2007
- Epidemiology [r]: Add brief definition or description - 23 August 2007
- Gay community [r]: Add brief definition or description - 16 August 2007
- Edward I [r]: Add brief definition or description - 9 August 2007
Rules and Procedure
Rules
- The primary criterion of eligibility for a new draft is that it must have been ranked as a status 1 or 2 (developed or developing), as documented in the History of the article's Metadate template, no more than one month before the date of the next selection (currently every Thursday).
- Any Citizen may nominate a draft.
- No Citizen may have nominated more than one article listed under "current nominees" at a time.
- The article's nominator is indicated simply by the first name in the list of votes (see below).
- At least for now--while the project is still small--you may nominate and vote for drafts of which you are a main author.
- An article can be the New Draft of the Week only once. Nominated articles that have won this honor should be removed from the list and added to the list of previous winners.
- Comments on nominations should be made on the article's talk page.
- Any draft will be deleted when it is past its "last date eligible". Don't worry if this happens to your article; consider nominating it as the Article of the Week.
- If an editor believes that a nominee in his or her area of expertise is ineligible (perhaps due to obvious and embarrassing problems) he or she may remove the draft from consideration. The editor must indicate the reasons why he has done so on the nominated article's talk page.
Nomination
See above section "Add New Nominees Here".
Voting
- To vote, add your name and date in the Supporters column next to an article title, after other supporters for that article, by signing
<br />~~~~. (The date is necessary so that we can determine when the last vote was added.) Your vote is alloted a score of 1. - Add your name in the Specialist supporters column only if you are an editor who is an expert about the topic in question. Your vote is alloted a score of 1 for articles that you created and 2 for articles that you did not create.
- You may vote for as many articles as you wish, and each vote counts separately, but you can only nominate one at a time; see above. You could, theoretically, vote for every nominated article on the page, but this would be pointless.
Ranking
- The list of articles is sorted by number of votes first, then alphabetically.
- Admins should make sure that the votes are correctly tallied, but anyone may do this. Note that "Specialist Votes" are worth 3 points.
Updating
- Each Thursday, one of the admins listed below should move the winning article to the Current Winner section of this page, announce the winner on Citizendium-L and update the "previous winning drafts" section accordingly.
- The winning article will be the article at the top of the list (ie the one with the most votes).
- In the event of two or more having the same number of votes :
- The article with the most specialist supporters is used. Should this fail to produce a winner, the article appearing first by English alphabetical order is used.
- The remaining winning articles are guaranteed this position in the following weeks, again in alphabetical order. No further voting should take place on these, which remain at the top of the table with notices to that effect. Further nominations and voting take place to determine future winning articles for the following weeks.
- Winning articles may be named New Draft of the Week beyond their last eligible date if their circumstances are so described above.
- The article with the most specialist supporters is used. Should this fail to produce a winner, the article appearing first by English alphabetical order is used.
Administrators
The Administrators of this program are the same as the admins for CZ:Article of the Week.
References
See Also
- CZ:Article of the Week
- CZ:Markup tags for partial transclusion of selected text in an article
- CZ:Monthly Write-a-Thon