Supply and demand/Tutorials: Difference between revisions
imported>Nick Gardner No edit summary |
imported>Nick Gardner |
||
| Line 11: | Line 11: | ||
===The supply function=== | ===The supply function=== | ||
<ref>Jacob Viner: "Cost Curves and Supply Curves", in ''Readings In Price Theory'', edited by G. J. Stigler and K. E. Boulding. Irwin, 1952.</ref> | |||
<ref>[http://www.econlib.org/Library/NPDBooks/Thirlby/bcthLS2.html#Robbins,%20Remarks%20on%20certain%20aspects Lionel Robbins: "Remarks Upon Certain Aspects of The Theory of Costs", ''Economic Journal'' March 1934.]</ref> | |||
<ref>[www.hlss.mmu.ac.uk/economics/research/discussion_papers/2006-02.pdf Arrigo Opocher and Ian Steedman: ''The Industry Supply Curve: Two Different Traditions'', Manchester University Department of Economics Working Paper 2006-2 2006]</ref> | |||
==Graphical representations== | ==Graphical representations== | ||
Revision as of 09:35, 2 May 2008
For practical purposes, and in the teaching of economics at the basic level, the law of supply and demand is normally taken as given - almost a statement of the obvious. Closer examination, reveals some features that are so far from obvious as to have been a matter of prolonged academic controversy.
Although not necessary for the understanding of the concepts, the graphical depiction of the law of supply and demand and the mathematical expressions of elasticities are presented in this tutorial because of their familiarity to students of economics.
The supply and demand functions
The demand function
The converse of the premise stated in the article is that the less of a thing that a person possesses, the more he is prepared to pay to acquire a little more of it. That means that, as price is increased, a progressively larger increase is needed to produce a given reduction in demand. Thus the slope of the price/demand curve increases as price is increased and falls as price is reduced - leading to a curve that is concave when viewed from above. However, it can be treated as a straight line without any loss of meaning when it is used in depicting the operation of the law of supply and demand.
The supply function
Graphical representations
-
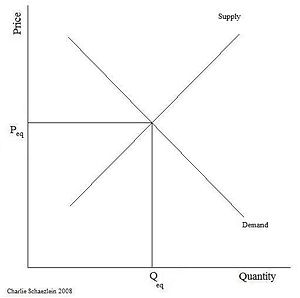
The basic diagram
This is the stylised representation of the law of supply and demand that is often used for teaching purposes.
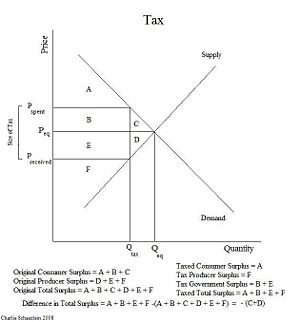
As it stands it adds nothing to Marshall's simple statement, but it is used as an introduction to the use of such diagrams to illustrate the concepts of consumer's and supplier's surplus, and to demonstrate the impact upon them of taxes and subsidies, as in the following diagram.
-
-
-
-
Consumers surplus and the effect of tax
-
-
-
-
-
-
-
-
-
-
-
-
-
The algebra of elasticity
- ↑ Jacob Viner: "Cost Curves and Supply Curves", in Readings In Price Theory, edited by G. J. Stigler and K. E. Boulding. Irwin, 1952.
- ↑ Lionel Robbins: "Remarks Upon Certain Aspects of The Theory of Costs", Economic Journal March 1934.
- ↑ [www.hlss.mmu.ac.uk/economics/research/discussion_papers/2006-02.pdf Arrigo Opocher and Ian Steedman: The Industry Supply Curve: Two Different Traditions, Manchester University Department of Economics Working Paper 2006-2 2006]

