Radiation/Gallery: Difference between revisions
Jump to navigation
Jump to search

imported>Anthony.Sebastian (add diagram of the EM spectrum) |
imported>Anthony.Sebastian mNo edit summary |
||
| Line 1: | Line 1: | ||
{{subpages}} | {{subpages}} | ||
{{Image|ElectroMagneticSpectrum.JPG|center| | {{Image|ElectroMagneticSpectrum.JPG|center|700px|Electromagnetic spectrum}} | ||
<br> | <br> | ||
{{Image|EMSpec.gif|center| | {{Image|EMSpec.gif|center|700px|Diagrammatic depiction of the electromagnetic spectrum. Note that as wavelengths become shorter and frequency of wave oscillations increase, the propagated energy increases (expressed in units of electron volts of photon energy). See diagram also in article, [[Electromagnetic radiation]].}} | ||
<br> | <br> | ||
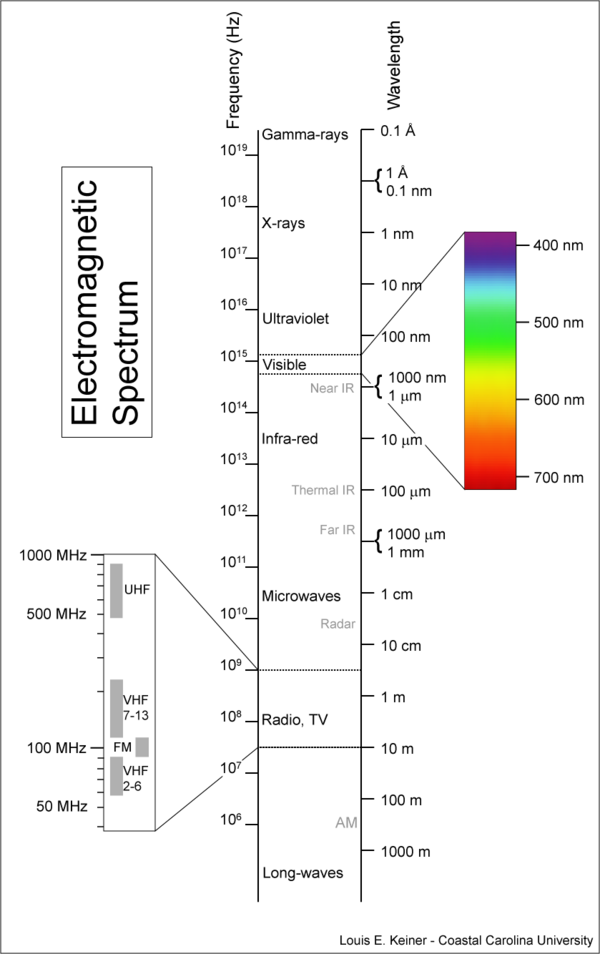
{{Image|Electromagnetic-Spectrum.png|center|600px|Fig. 1: Overview of the [[electromagnetic spectrum]]. }} | {{Image|Electromagnetic-Spectrum.png|center|600px|Fig. 1: Overview of the [[electromagnetic spectrum]]. }} | ||
Revision as of 23:15, 18 July 2010


(PD) Diagram: The Electromagnetic Spectrum. The Advanced Light Source (ALS), a division of Berkeley Lab. Greg Vierra, graphic design
Diagrammatic depiction of the electromagnetic spectrum. Note that as wavelengths become shorter and frequency of wave oscillations increase, the propagated energy increases (expressed in units of electron volts of photon energy). See diagram also in article, Electromagnetic radiation.
Diagrammatic depiction of the electromagnetic spectrum. Note that as wavelengths become shorter and frequency of wave oscillations increase, the propagated energy increases (expressed in units of electron volts of photon energy). See diagram also in article, Electromagnetic radiation.
