IS-LM model: Difference between revisions
imported>Marcelo B. Barata Ribeiro m (IS/LM model moved to IS-LM model: Due to technical limitations, article titles can't have a slash) |
imported>Marcelo B. Barata Ribeiro (Placed Subpages template) |
||
| Line 1: | Line 1: | ||
{{Subpages}} | |||
The [[IS/LM model]] is a mathematical model developed by [[John Hicks]] and [[Alvin Hansen]] in order to describe macroeconomic ideas proposed by John Maynard Keynes in its ''General Theory of Employment, Interest and Money''. | The [[IS/LM model]] is a mathematical model developed by [[John Hicks]] and [[Alvin Hansen]] in order to describe macroeconomic ideas proposed by John Maynard Keynes in its ''General Theory of Employment, Interest and Money''. | ||
Revision as of 11:16, 12 September 2008
The IS/LM model is a mathematical model developed by John Hicks and Alvin Hansen in order to describe macroeconomic ideas proposed by John Maynard Keynes in its General Theory of Employment, Interest and Money.
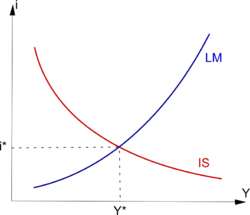
The model presents simultaneously two curves, IS and LM, in a graph in which the horizontal axis represents national income (Y) and the vertical axis represents the interest rate (i).
- IS illustrates the relationship between the level of income (Y) and the interest rate (i) in the real sector (goods and services). Lower is the interest rate higher is investment and thus the income.
- LM describes the relationship between the level of income and the interest rate in the monetary market. Higher is the level of income, higher is the need for money and thus the interest rate.
The intersection of the curves represents the general equilibrium for which both relationships are verified, that is to say the actual equilibrium of the economy.
The IS/LM model is the most common macroeconomic model. It enables to understand easily the relationships between the real sector and the monetary market as well as the effects of monetary and fiscal policies.
The model
Equilibriums in the real market : IS curve
“IS” stands for “investment and saving”. The IS curve represents all equilibriums for which total spending (consumption and investment) equals total output (income). This equation is equivalent to the equality between investment and saving, which is a basic accounting equation in a closed economy.
Investment is a decreasing function of interest rate. Indeed, the interest rate represents the opportunity cost of an investment. Higher is the interest rate, higher must be the return on investment. It implies that when the interest rate is high many investments whose profitability would be low are not undertaken.
I is a decreasing function of i, and so is Y. Then IS is a decreasing curve.
Equilibriums in the monetary market : LM curve
“LM” refers to “Liquidity preference and money supply”. The LM curve represents all equilibriums where demand equals supply on the monetary market.
According to Keynes, people hold liquidities for two reasons.
- Citizens need cash for every day life transactions and because of uncertainty (they are cautious). Keynes calls those needs “transactions demand for money”. It is positively related to income (Y).
- When people want to save they must choose between securities (financial markets) and money. Money can be considered as an asset among others and its price is the interest rate. Keynes suggests that when the interest rate seems too low, speculators expect it to rise and thus "buy" (by selling financial assets for example) or borrow money. On the contrary, when they think that the interest rate is too high, speculators expect it to drop and sell money (by buying financial assets for example).
So, according to Keynes, demand for money includes transactions demand (L1) and speculative demand (L2). In equilibrium we have the following relationship.
And since
then LM is a increasing curve.
General equilibrium
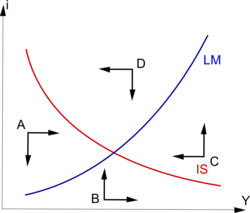
The general equilibrium is given by the intersection of IS and LM. The level of income and the interest rate can diverge from their equilibrium level only on a temporary basis. Indeed,
- If the interest rate and the income are situated at point A, then it means that in the goods and services market, supply is insufficient to balance demand. Prices will rise and so will production. It also means that demand is insufficient to balance supply on the monetary market which will make the interest rate fall.
- At point B, supply of goods and services is also insufficient and so is money supply. This combination implies a rise of both output and interest rate.
- At point C, supply exceeds demand in the real market, and then companies must reduce their output. The lack of money make interest rate rise.
- At point D, supply exceeds demand in both the real market and the monetary market. Both production and interest rate will drop.


