CZ:Statistics
Since its 2006 inception and official launch (March 28, 2007), Citizendium has grown. This page provides statistics on Citizendium's output of articles and its contributor base.[1]
Timeframe
The statistical charts below draw upon data between October 22, 2006 and May 10, 2007. For technical reasons, the graphs are scaled in working days. Here is the translation into the calendar dates.
1 : 2006-10-22
50 : 2006-12-11
100: 2007-01-30
150: 2007-03-21
200: 2007-05-10
launch: 2007-03-28, i.e. 157th working day
last day on daily graphs = 2006-06-09 (figures 1 to 5)
Pages
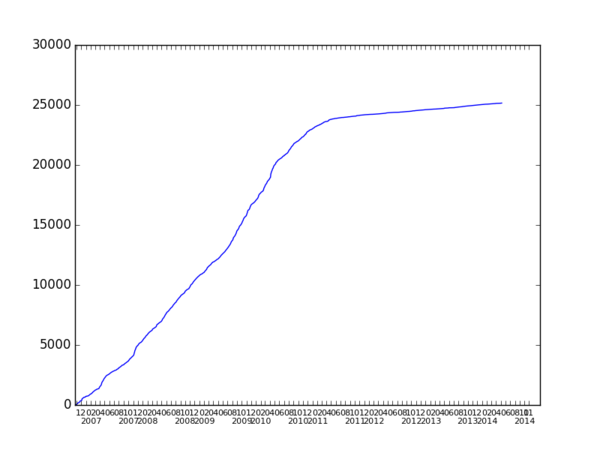
Number of articles and pagesThe first graph shows the number of articles (technically speaking, all pages from mainspace without redirects). Observe an acceleration after the launch (about 150). As a trivia fact, one may notice a small jump about 50th day. What was it? On December 7, 2006, some viper articles were uploaded. |
|
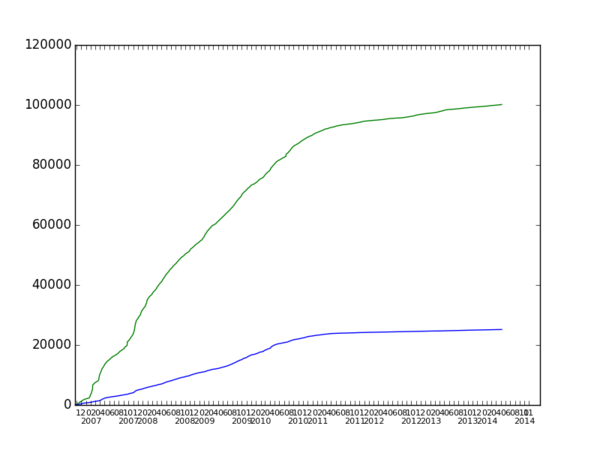
The second graph shows number of all pages from all namespaces (e.g. userpages, talk pages and images are included, redirects are _not_). This is the green line. The blue line is the one from the first graph (i.e. the mainspace pages). What happened about 125th day? It was Saint Valentine's, 14/02/2007, when after slashdotting many new users registered (and were welcomed on their talk pages!). Notice that at the same time there was no parallel growth in the mainspace. Apparently, the newly registered users were mainly watching, since at that time there was no unregistered access. Again, a more stable growth rate has been established after the launch. |
Rate of article and page creation
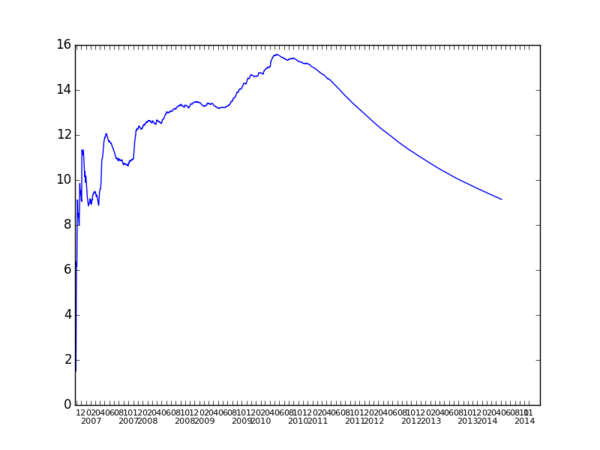
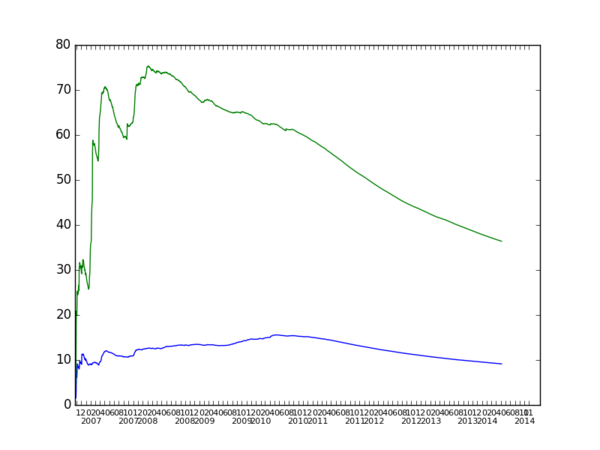
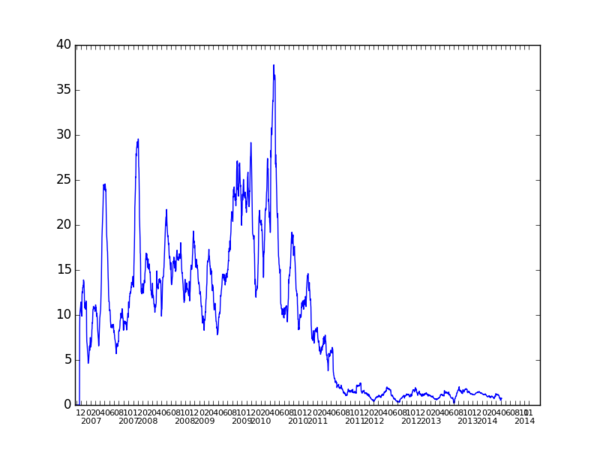
The third and fourth figure present "global creation rate". It measures somehow the activity on the wiki expressed in new pages per day. The rate for "pure" articles (technically: mainspace without redirects) is depicted in blue; the green line corresponds to all pages (still, without redirects). This is calculated as the number of articles (pages, respectively) divided by the number of working days from the beginning. Obviously, this is a "global average" and the recent creation rate is higher than the one on the beginning. This can be seen on the 5th and last graph of this section, which represents the creation rate for articles taking into account last 30 days only.
Human resources
Number of authors
The following graphs describe the CZ human resources.
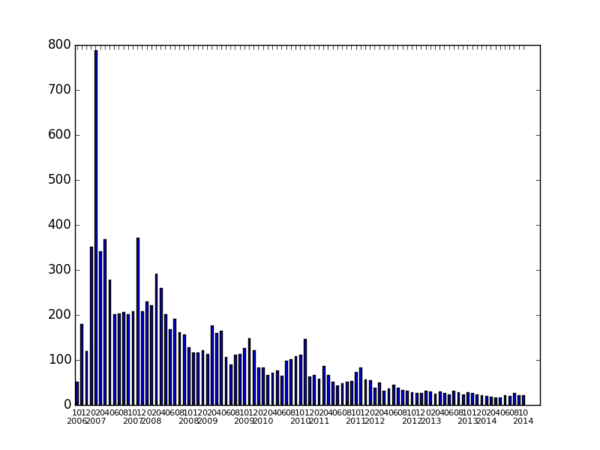
- How many authors edit each month? The Fig. 6 presents the number of users that made at least one edit (separately for each month).
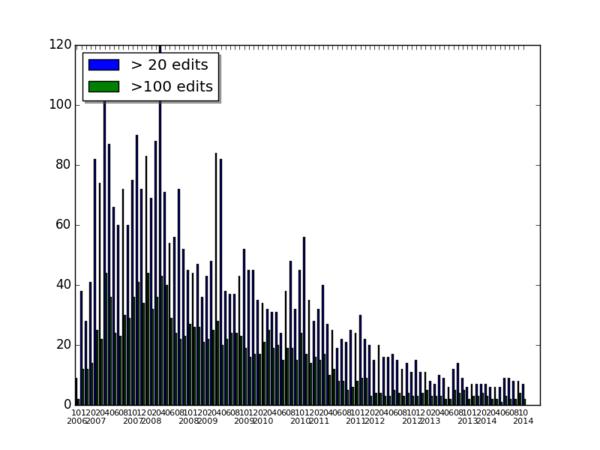
- How many users are active? If by "activity" we define at least 20 edits per month, and by "high activity" we understand at least 100 edits per month, then the answer is given by the Fig. 7 below.
Daily use
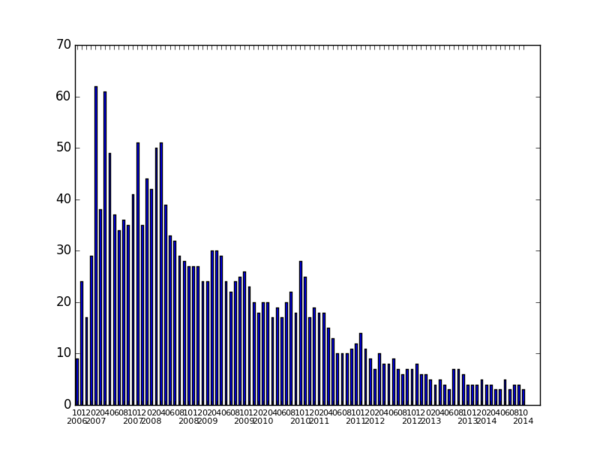
How many users you could meet here daily? While correlated with other HR measures, this one seems to be interesting since it shows how many people make the community on a daily basis. See the figure below.[2]
New arrivals
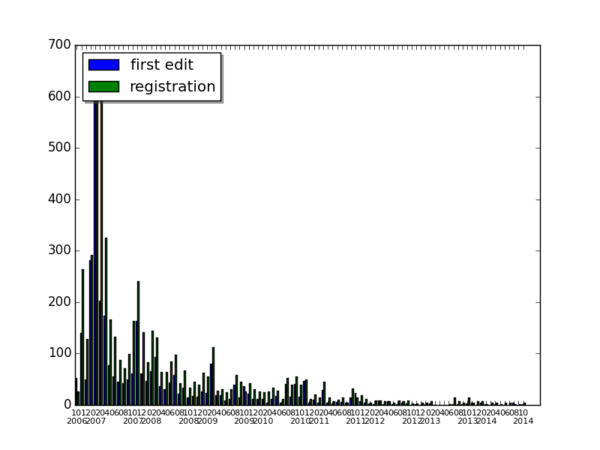
Fig. 9: How many new authors arrive each month? This can be measured by counting new user pages. More substantial measure would be, however, to detect a new user on his first edit. Notice that in the period of self-registration (essentially, one week in January and two weeks in February 2007) the two measures largely coincide, as the new users were supposed to provide their bio. There was also a spike in March due to our launch.
Comparison to other wikis
How does the statistical data shed light on Citizendium's strength in terms of human resources? Since April 2007 is the first month after the wiki's official launch, it is instructive to compare Citizendium with several active projects to similar size and mission. In the chart below, Citizendium is compared to several language Wikipedias. This analysis counts the registered users of each site.[3]
As of April 2007, the human resources of CZ are comparable to resources of these Wikipedias from the category "more than 25,000 entries" [4]. For example, CZ would be of the same order of magnitude as hr.wikipedia.org, lt.wikipedia.org, sl.wikipedia.org (these were slightly smaller) or sr.wikipedia.org (this one was a bit bigger than CZ). As a sidenote, there were not many active IP anons on these wikis (about 10), roughly as many as robots that were taken into account. Notice also that there are 24 Wikipedias altogether in the categories "more than 50000", "more than 100000" and "more than 250000" entries.
Development in May
Here are some statistics regarding CZ's activity in May (a comparison between 1 May and 1 June).
- Articles: 2459 -> 2820 (this includes no redirs)
- CZ Live: 1719 -> 1957
- Checklisted_Articles : 1773 -> 2340
- Internal_Articles : 1313 -> 1764
- External_Articles : 461-> 575
- Stub_Articles : 292 -> 377
- Developing_Articles : 582 -> 835
- Developed_Articles : 427 -> 536
- Approved_Articles : 15 -> 22
Caveats: pages are created continuously, a two-digit number per day in some categories. So "the number of articles for a given day" is a somewhat fuzzy notion. Technically, it's just the number you get by counting members of a given category at a moment in time (the moment being somewhat random). So the numbers above just show some general proportions and perhaps the last digit should not be considered meaningful.
In terms of "human resources" we had
- 283 users editing in May
- 92 active users (with more than 20 edits); they contributed more than 95% of edits.
- 36 very active users (more than 100 edits)
- 82 new users (as detected on first edit, not by a new userpage)
- 50 authors daily on wiki (on average)
- about 30% of users editing in May (80 persons) were there in April and March
- 23 authors have been here for 6 months without break (i.e. from November 2006, the beginnig)
Activity:
- 20K total edits, 44% in the mainspace
- mean activity is 70 edits per editor this month
- 2147 new pages (all namespaces)
- 628 new pages in the mainspace (redirs included)
Caveats: Here the numbers are well-defined ("exact"), as based on history of edits of all pages (dumped on 9 June). Still, the wiki moves, e.g. some pages get deleted, so even stats concerning the past can slightly change in time.
Notes
- ↑ The graphs have been produced using the publicly available data from the history of edits of all Citizendium pages. Concerning the comparison with the Wikipedia, the "stub-meta-history" dump files were used (see the appropriate subpages from this index).
- ↑ Another measure of this type would be the number of 'devoted' users, i.e. those who edit the wiki on more than say 80% of working days since the first edit. This is a bit more sophisticated computation (still to do), but it would give a complementary answer to the question "how large the wiki community is".
- ↑ Although the analysis excludes IP anonymous users, globally such users to not make too many edits (8-15%, depending on the wiki) and rarely an IP is really active (makes more than 20 edits). Excluding those active IPs is somewhat compensated by the fact that, for the sake of simplicity, we count Wikipedia 'robots' as regular users.
- ↑ As listed on the Main Page of the English Wikipedia
