CZ:Statistics: Difference between revisions
imported>Aleksander Stos m (→Pages: typo) |
imported>Aleksander Stos (human resources section, graphs to be added) |
||
| Line 44: | Line 44: | ||
</table> | </table> | ||
== | ==Human resources== | ||
The following graphs describe the human resources. | |||
* Fig. 6. How many authors edit each month | |||
* Fig. 7. How many new authors arrive each month. This can be measured by counting new user pages. More substantial measure would be, however, to detect a new user on his first edit. Notice that in the period of self-registration (essentially, February 2007) the two measures largely coincide, as the new users were supposed to provide their bio. | |||
* Fig. 8. How many active users edit each month. By an active user here we mean an author that made more than 20 edits. Those who made more than 100 edits are called ''very'' active. | |||
* Fig. 9. How many users you could meet here daily (on average). | |||
<!--It was observed that if one counts the registered users then CZ's human resources of these figures are comparable to those of Wikipedias from the category "more than 25,000 entries" (as listed on the main page of the English Wikipedia). For example, CZ would be in order of magnitude of lt.wikipedia.org, hr.wikipedia.org (these were slightly smaller) or sr.wikipedia.org (this one was slightly bigger).--> | |||
Revision as of 11:28, 18 May 2007
Here we present basic statistics concerning the project.
At present, the graphs are scaled in working days. Here is the translation into the calendar dates.
1 : 2006-10-22
50 : 2006-12-11
100: 2007-01-30
150: 2007-03-21
200: 2007-05-10
launch: 2007-03-28 (?), i.e. 157th working day
last pictured day = 2007-05-17
Pages
|
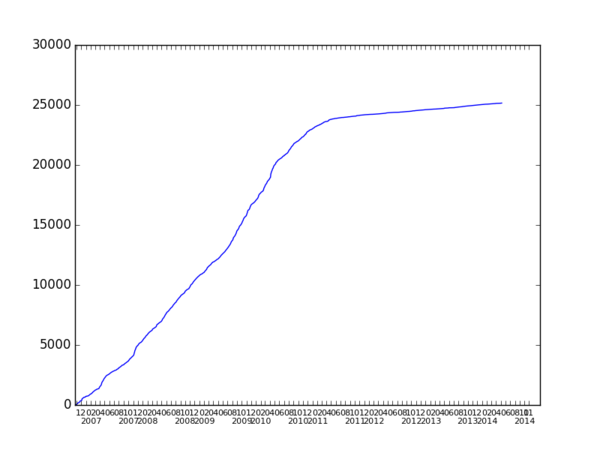
The first graph shows the number of articles (technically speaking, all pages from mainspace without redirects). Observe an acceleration after the launch (about 150). As a trivia fact, one may notice a small jump about 50th day. What was it? On December 7, 2006, some viper articles were uploaded. |
|
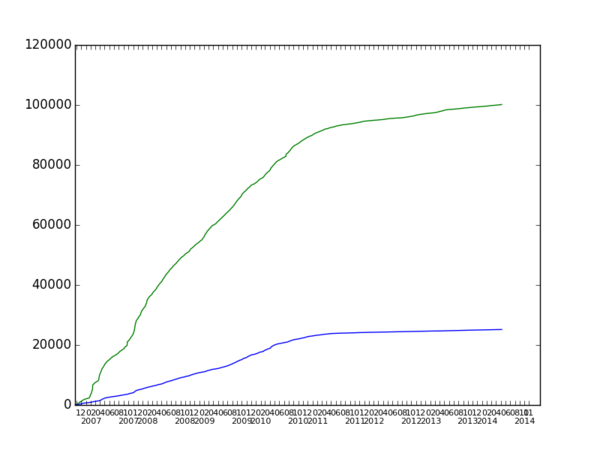
The second graph shows number of all pages from all namespaces (e.g. userpages, talk pages and images are included, redirects are _not_). This is the green line. The blue line is the one from the first graph (i.e. the mainspace pages). What happened about 125th day? It was Saint Valentine's, 14/02/2007, when after slashdotting many new user registered (and were welcomed on their talk pages!). Notice that at the same time there was no significant growth in the mainspace. Apparently, the newly registered users were mainly watching (at the time there was no unregistered access to the wiki). Again, a more stable growth rate has been established after the launch. |
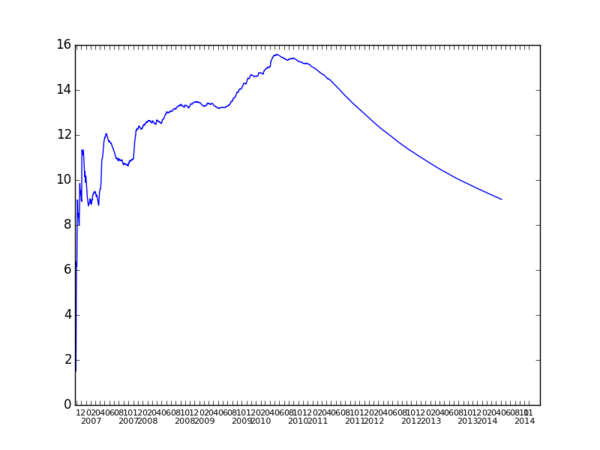
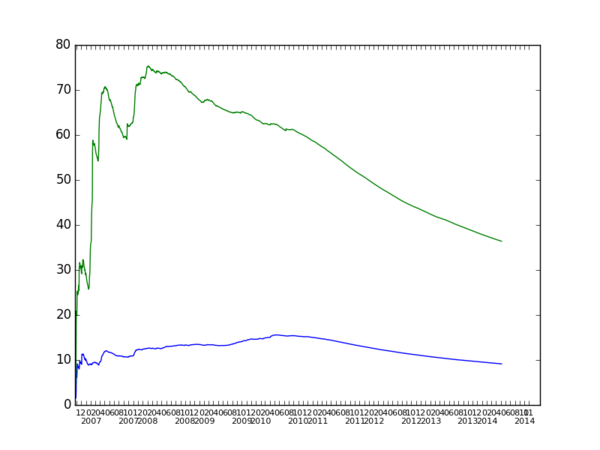
The third and forth figure present "global creation rate". It measures somehow the activity on the wiki expressed in new pages per day. The rate for "pure" articles (technically: mainspace without redirects) is depicted in blue; the green line corresponds to all pages (still, without redirects). This is calculated as the number of articles (pages, respectively) divided by the number of working days from the beginning.[1] Obviously, this is a "global average" and the recent creation rate is higher than the one on the beginning. This can be seen on the 5th and last graph of this section, which represents the creation rate for articles taking into account last 30 days only.
Human resources
The following graphs describe the human resources.
- Fig. 6. How many authors edit each month
- Fig. 7. How many new authors arrive each month. This can be measured by counting new user pages. More substantial measure would be, however, to detect a new user on his first edit. Notice that in the period of self-registration (essentially, February 2007) the two measures largely coincide, as the new users were supposed to provide their bio.
- Fig. 8. How many active users edit each month. By an active user here we mean an author that made more than 20 edits. Those who made more than 100 edits are called very active.
- Fig. 9. How many users you could meet here daily (on average).
- ↑ Technical sidenote: on the third graph the first two days were truncated for the obvious reason: starting with, say, 25 pages --so with a realtively high creation rate-- is not very relevant, results in changing the scale and makes the graph less readable.
