CZ:Statistics
Here we present basic statistics concerning the project.
At present, the graphs are scaled in working days. Here is the translation into the calendar dates.
1 : 2006-10-22
50 : 2006-12-11
100: 2007-01-30
150: 2007-03-22
200: 2007-05-11
launch: 2007-03-28 (?), i.e. 157th working day
last pictured day = 2007-05-17
Pages
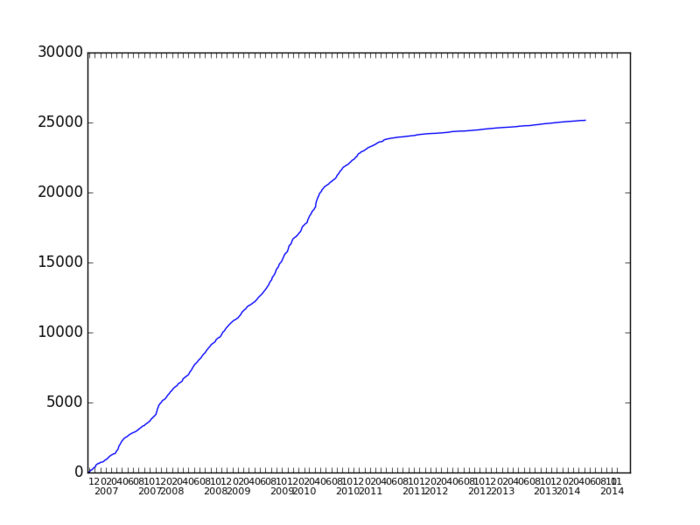
The first graph shows the number of articles (technically speaking, all pages from mainspace without redirects). Observe an acceleration after the launch (about 150). As a trivia fact, one may notice a small jump about 50th day. What was it? On December 7, 2006, some viper articles were uploaded.
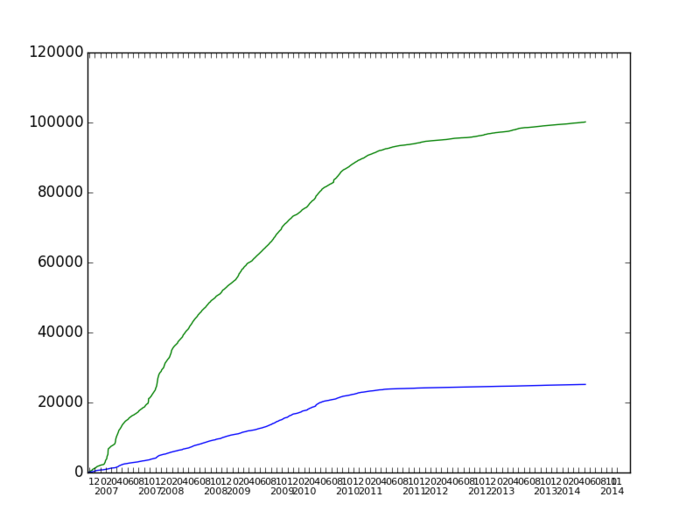
The second graph depictures number of all pages from all namespaces (e.g. userpages, talk pages and images are included, redirects are _not_). This is the green line. The blue line is the one from the first graph (i.e. the mainspace pages). What happened about 125th day? It was Saint Valentine's, 14/02/2007 when after slashdotting many new user registered. Notice that at the same time there was no significant growth in the mainspace. Apparently, the newly regitered users were mainly watching (at the time there was no unregistered access to the wiki). Again, a more stable growth rate has been achieved after the launch.
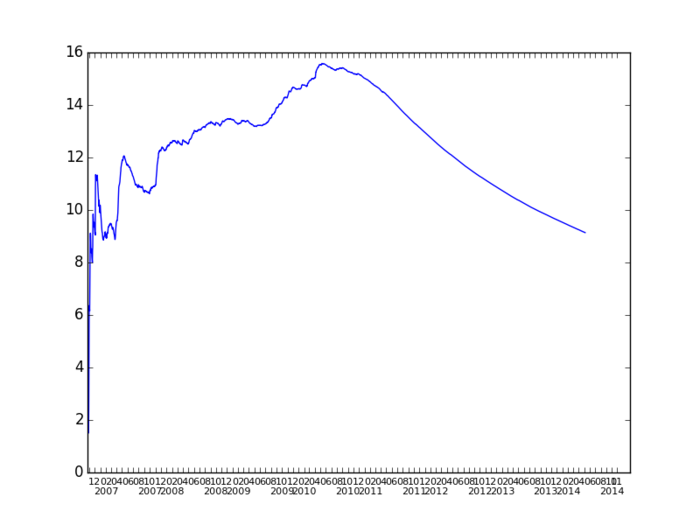
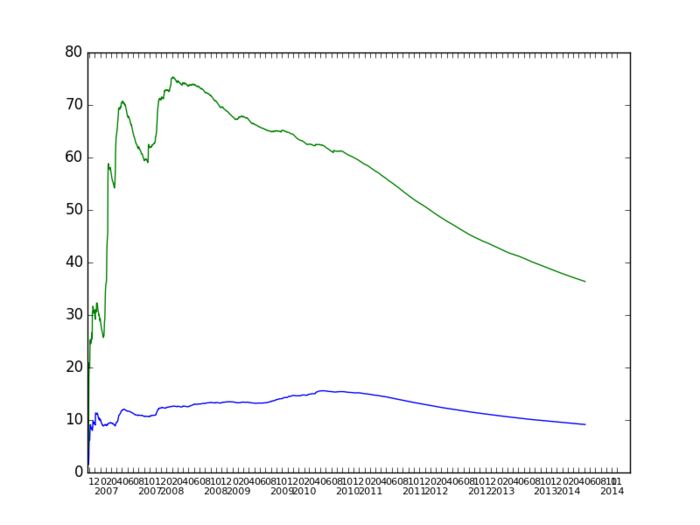
The third and forth figure present "global creation rates". The rate for "pure" articles (technically: mainspace without redirects) is traced in blue; the green line corresponds to all pages (still, without redirects). This is calculated as the number of articles (pages, respectively) divided by the number of working days.
Authors
To be continued...


