Search results
Jump to navigation
Jump to search
Page title matches
- ...ty pictures: Can images stop data overload?"}} </ref> Therefore, effective data visualisation should be clear and simple to the reader. Effective data visualisation requires a combination of skills. Designing an effective visualisation is b6 KB (790 words) - 17:01, 4 August 2024
- ...s was used some time ago. However, the page certainly looks like a form of data visualisation, although the link on the page now points to musical mashups, nothing relat2 KB (279 words) - 10:23, 16 December 2020
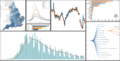
File:Data-visualisation-example-charts.PNG (1,145 × 586 (70 KB)) - 19:58, 11 March 2022- 163 bytes (20 words) - 01:10, 30 August 2020
- | pagename = Data visualisation838 bytes (67 words) - 01:07, 30 August 2020
- 915 bytes (144 words) - 17:01, 4 August 2024
- 37 bytes (5 words) - 11:35, 26 October 2020

Page text matches
- #REDIRECT [[Data visualisation]]32 bytes (3 words) - 01:05, 30 August 2020
- #REDIRECT [[Data visualisation/Definition]]43 bytes (4 words) - 01:10, 30 August 2020
- #REDIRECT [[Talk:Data visualisation]]37 bytes (4 words) - 01:05, 30 August 2020
- data visualisation and presentation,510 bytes (63 words) - 04:05, 22 November 2023
- | pagename = Data visualisation838 bytes (67 words) - 01:07, 30 August 2020
- ...formation, including diffferent database types, data warehouses, ELT, ELT, data visualisation and the importantance of process in ensuring good data quality.715 bytes (93 words) - 02:51, 22 November 2023
- ...ty pictures: Can images stop data overload?"}} </ref> Therefore, effective data visualisation should be clear and simple to the reader. Effective data visualisation requires a combination of skills. Designing an effective visualisation is b6 KB (790 words) - 17:01, 4 August 2024
- ...ot type used in astronomy. It should be related to this article, and to [[Data visualisation]]--and maybe the two articles should be merged? [[User:Pat Palmer|Pat Palme308 bytes (44 words) - 07:24, 9 April 2022
- ...s was used some time ago. However, the page certainly looks like a form of data visualisation, although the link on the page now points to musical mashups, nothing relat2 KB (279 words) - 10:23, 16 December 2020
- == Data visualisation / visualization ==13 KB (2,247 words) - 15:01, 24 January 2023
- A '''mashup''' is a complex form of [[Data visualisation|data visualization]]. On the web, mashup often refers to an integrated app24 KB (3,765 words) - 12:01, 16 September 2024
- * [[Scientific_visualization]] and [[Data visualisation]] - merge?56 KB (7,919 words) - 13:18, 17 September 2024