Search results
Jump to navigation
Jump to search
Page title matches
- A '''Bode plot''', named after [[Hendrik Wade Bode]], is a combination of a Bode magnitude ...[logarithm|log]] magnitude versus [[frequency]]. The magnitude axis of the Bode plot is usually expressed as [[decibel]]s, that is, 20 times the common logarith24 KB (3,933 words) - 02:20, 14 October 2013
- 216 bytes (29 words) - 20:33, 3 June 2011
- | pagename = Bode plot | abc = Bode plot818 bytes (67 words) - 20:26, 3 June 2011
- 309 bytes (48 words) - 20:30, 3 June 2011
- 1 KB (148 words) - 12:10, 6 June 2011
- 868 bytes (139 words) - 10:47, 6 June 2011
File:Bode plot for pole and zero.PNG (644 × 291 (42 KB)) - 19:56, 11 March 2022- 37 bytes (6 words) - 15:57, 3 June 2011
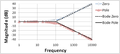
File:Gain Bode plot for two-pole amplifier.PNG (637 × 555 (50 KB)) - 19:57, 11 March 2022- 37 bytes (6 words) - 12:04, 3 June 2011


Page text matches
- | pagename = Bode plot | abc = Bode plot818 bytes (67 words) - 20:26, 3 June 2011
- |Gain Bode plot for two-pole amplifier.PNG|Bode gain plot to find phase margin of two-pole |High-pass amplifier Bode plot.PNG|The Bode plot for a first-order (one-pole) [[highpass filter]]8 KB (1,175 words) - 04:07, 22 November 2023
- {{r|Bode plot}}863 bytes (139 words) - 12:05, 5 June 2011
- {{r|Bode plot}}884 bytes (142 words) - 10:42, 6 June 2011
- A '''Bode plot''', named after [[Hendrik Wade Bode]], is a combination of a Bode magnitude ...[logarithm|log]] magnitude versus [[frequency]]. The magnitude axis of the Bode plot is usually expressed as [[decibel]]s, that is, 20 times the common logarith24 KB (3,933 words) - 02:20, 14 October 2013
- {{r|Bode plot}}3 KB (357 words) - 04:07, 22 November 2023
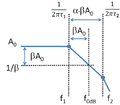
- {{Image|Two-pole Bode magnitude plot.PNG|right|250px|Idealized [[Bode plot]] for a two pole amplifier design. Gain drops from first pole at ''f<sub>1< ...position ''f''<sub>2</sub> to obtain the design is shown in the adjacent [[Bode plot]]. At the lowest pole ''f''<sub>1</sub>, the Bode gain plot breaks slope to18 KB (3,162 words) - 09:46, 6 June 2011
- |Gain Bode plot for two-pole amplifier.PNG|Bode gain plot to find phase margin of two-pole |High-pass amplifier Bode plot.PNG|The Bode plot for a first-order (one-pole) [[highpass filter]]19 KB (2,805 words) - 04:07, 22 November 2023
- ...aximal_flatness|''maximally flat'']] design that shows no peaking in the [[Bode plot|Bode gain ''vs.'' frequency plot]]. That design has the rule of thumb built {{Image|Gain Bode plot for two-pole amplifier.PNG|right|200px|Bode gain plot to find phase margin;20 KB (3,032 words) - 09:34, 9 October 2013
- ...terion]] developed by [[Harry Nyquist]] of [[Bell Laboratories]], or the [[Bode plot]] can be used to study the stability of feedback amplifiers. ...but less general technique, uses [[Bode_plot#Gain_margin_and_phase_margin|Bode plot]]s.14 KB (2,165 words) - 09:35, 3 July 2011