Bioinformatics
Bioinformatics is the use of statistical methods to search for patterns within a set of biological data. Such patterns can be used to determine diagnostic biomarkers for a particular disease, to measure the efficacy of a particular medical treatment, compare DNA sequences for similarity in order to define relatedness, such as between man and mouse, determine what biological responses are presented by surviving versus dying patients, and predict biological pathways.
Bioinformatics is a subfield of Computational biology, Systems biology and Bioengineering. Bioinformatics is not the same as Medical informatics, or Healthcare informatics, which addresses clinical and public health aspects of the health care industry, although bioinformatics and medical informatics together are sometimes called, more broadly, Biomedical Informatics.
Bioinformatics subfields
Genomics compares the genes present in the DNA of different patients (or animals) to determine relatedness or perhaps find the gene defect responsible for an inheritable disease. The search for Single Nucleotide Polymorphisms (SNiPs), which are single (point) mutations in a gene, is one example of this method.
Transcriptomics compares levels of messenger RNA (mRNA) to elucidate which genes are up-regulated or down-regulated to help determine which biological pathways may be involved in a particular disease, drug treatment, or clincal outcome. Such studies are typically performed on a "gene" chip containing tens of thousands short complimentary DNA fragments, or cDNA fragments, often called probes, each designed to bind with a particular mRNA molecule.
Proteomics compares the levels of thousands of proteins present in a biological sample. A typical sample might be a whole-cell extacts, perhaps isolated from blood or a particular organ, which is separated into multiple fractions by liquid or gas chromatography, and then further separated and quantified by mass spectroscopy or 2D gel electrophoresis methods. Like transcriptomics, proteomics helps define biological pathways associated with the condition being studied.
Metabolomics (Metabonomics) studies determine the variation of metabolites present in a biological sample, most often blood plasma, urine, or cerebral spinal fluid. Tissue extracts (kidney, liver) from homogenized organ tissue can also been used. The metabolites are typically determined using nuclear magnetic resonance (NMR) or mass spectroscopy (MS). Jeremy K. Nicholson is often credited with developing metabonomics. David Wishart and coworkers have recently announced the first draft of the human metabolome database. (http://redpoll.pharmacy.ualberta.ca/hmdb/HMDB/)
Kinomics studies determine the level of different kinases, which, via phosphorylation of other proteins, play a large role in cell signaling and many biological pathways.
Drug Design deals with designing new molecules of drugs based on the properties of some older durgs and the properties of the selected target cells, through computers.
Mathematical Tools
Some of the mathematics tools most commonly used in bioinformatics are listed below.
Normalization is used to reduce the importance of very large signals relative to weak signals, and often uses Z-scores, which redefines the data points in terms of +/- standard deviations from the mean. Thus, a very weak signal that increases 5-fold is determined to be more important that an extremely large signal that increases 10%. The use of un-normalized signal intensities would likely obscure the significant increase in the weaker signal.
Hierarchical Clustering aims to define a finite number of groups such that members of any particular group cluster very closely to each other, while similtaneously remain very distant from all other groups. Distance can be defined in a number of different ways, using for example, Euclidean distance, Manhattan distance or Pearson correlation distance.
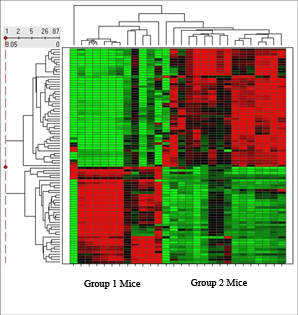
Heat Maps are used to visually display which variables, such as genes, proteins or metabolites, are up- or down-regulated within each group (see figure).
ANOVA (Analysis of Variance) determines relationships not on magnitudes of signals but on the co-variation of signals. For example, in animal group one, proteins X, Y, Z always increase while protein A, B, C descrease. In animal group two, protein A, C, and Y always increase while proteins B, X and Z always decrease. With ANOVA analysis, the magnitude of the increases or decreases is less important than the pattern.
Principal Components Analysis (PCA)
