File:HoverGraph.PNG: Difference between revisions
Jump to navigation
Jump to search
imported>Charles Blackham No edit summary |
imported>Charles Blackham No edit summary |
||
| Line 1: | Line 1: | ||
Typical graph of temperature vs. hover time for the Leidenfrost effect. By [[User:Charles Blackham|Charles Blackham]], released to the Public Domain. | |||
Revision as of 17:08, 18 April 2007
Typical graph of temperature vs. hover time for the Leidenfrost effect. By Charles Blackham, released to the Public Domain.
File history
Click on a date/time to view the file as it appeared at that time.
| Date/Time | Thumbnail | Dimensions | User | Comment | |
|---|---|---|---|---|---|
| current | 19:55, 11 March 2022 | 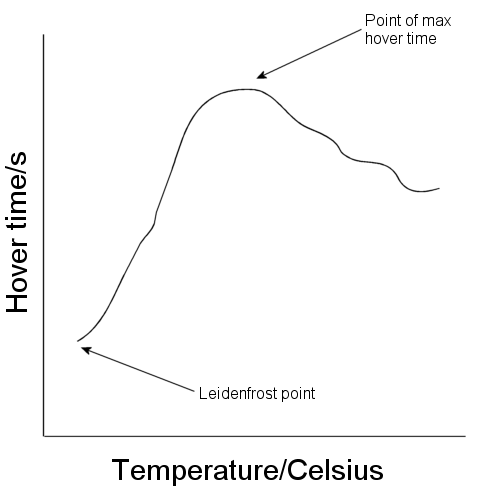 | 500 × 500 (17 KB) | Maintenance script (talk | contribs) | == Summary == Importing file |
You cannot overwrite this file.
File usage
The following page uses this file: