Supply and demand/Tutorials: Difference between revisions
Jump to navigation
Jump to search

imported>Nick Gardner |
imported>Nick Gardner |
||
| Line 12: | Line 12: | ||
===The basic diagram=== | ===The basic diagram=== | ||
This is the stylised representation of the law of | |||
supply and demand that is often used for teaching | |||
purposes (with the labels reversed, unfortunately) | |||
- | - | ||
Revision as of 05:31, 27 April 2008
(Introduction to be added)
Graphical representations of supply and demand
The shape of the demand curve
The converse of the premise stated in the article is that the less of a thing that a person possesses, the more he is prepared to pay to acquire a little more of it. That means that, as price is increased, a progressively larger increase is needed to produce a given reduction in demand. Thus the slope of the price/demand curve increases as price is increased and falls as price is reduced - leading to a curve that is concave when viewed from above.
-
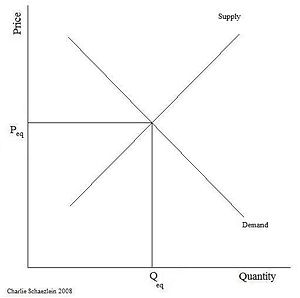
The basic diagram
This is the stylised representation of the law of
supply and demand that is often used for teaching
purposes (with the labels reversed, unfortunately)
-
-
-
-
-
-
-
-
-
-
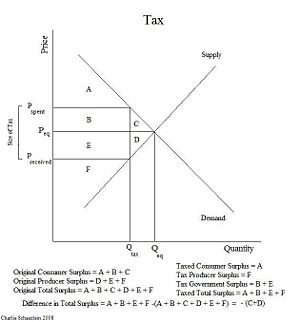
Consumers surplus and the effect of tax
-
-
-
-
-
-
-
-
-
-
-
-
-

