File:Iceage time-slice hg.png: Difference between revisions
Jump to navigation
Jump to search
imported>Corinne Sober ({{Image notes |Description= The progression of the current ice age is shown in six time slices of different linear scale. The change in temperature (degrees centigrade) is shown in: 180 Mio yr, 800 kyr, 150 kyr, 18 kyr, 1 kyr, 120 yr. Start at the top right and read to upper left, following the gray shaded boxes. The following graph includes a higher resolution, breaking time into a shorter frame. We see climate variations (glacial/interglacial cycles) during the ice age of the last 2 Milli...) |
(No difference)
|
Revision as of 01:27, 29 March 2008
File history
Click on a date/time to view the file as it appeared at that time.
| Date/Time | Thumbnail | Dimensions | User | Comment | |
|---|---|---|---|---|---|
| current | 19:53, 11 March 2022 | 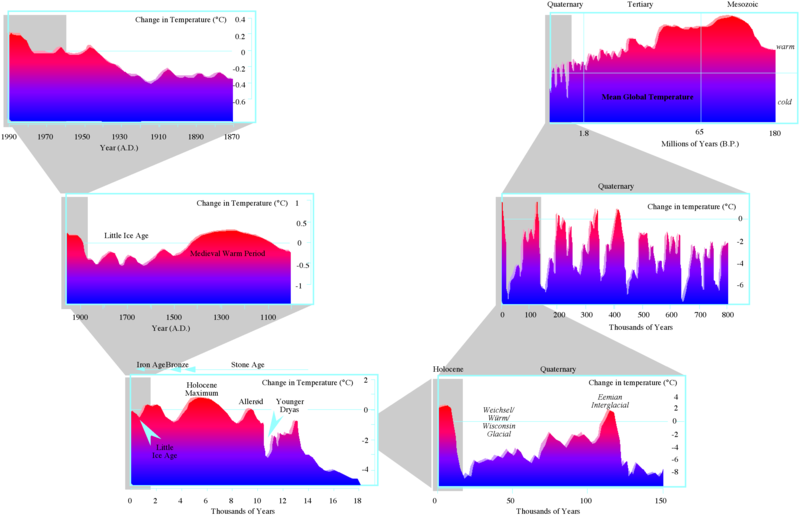 | 800 × 517 (99 KB) | Maintenance script (talk | contribs) | == Summary == Importing file |
You cannot overwrite this file.
File usage
The following page uses this file: