Maple (software): Difference between revisions
Jump to navigation
Jump to search

imported>Igor Grešovnik (Created the article) |
imported>Dmitrii Kouznetsov (Graphics in Maple) |
||
| (3 intermediate revisions by 3 users not shown) | |||
| Line 1: | Line 1: | ||
'''Maple''' is a commercial [[ | {{subpages}} | ||
'''Maple''' is a commercial [[computer algebra system]] and a general purpose mathematics software. It is developed by the [[Waterloo Maple Inc.]] | |||
==Examples of graphics with Maple== | |||
[[Image:MapleGraphicsExamples.jpg|500px|right]] | |||
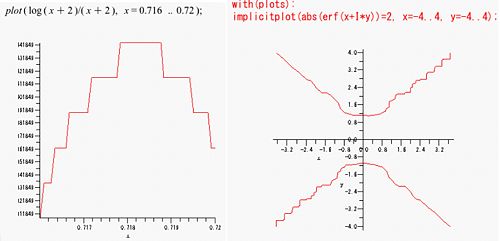
Maple allows to generate graphics with short codes. Two examples of the code and the graphics are shown in the figure.<br> | |||
The left graphics is plot of function <math>f=\frac{\log(x+2)}{x+2}</math> for the range <math>0.716<x<0.72</math>; <br> | |||
The right graphic is implicit plot of solution of equation <math>|\mathrm{erf}(x+{\rm i} y)|=2 </math> in the <math>x,y</math> plane. | |||
Revision as of 05:16, 25 January 2009
Maple is a commercial computer algebra system and a general purpose mathematics software. It is developed by the Waterloo Maple Inc.
Examples of graphics with Maple

Maple allows to generate graphics with short codes. Two examples of the code and the graphics are shown in the figure.
The left graphics is plot of function for the range ;
The right graphic is implicit plot of solution of equation in the plane.


