File:WTI price 96 09.svg
Jump to navigation
Jump to search

Size of this PNG preview of this SVG file: 600 × 480 pixels. Other resolution: 2,560 × 2,048 pixels.
Original file (SVG file, nominally 600 × 480 pixels, file size: 60 KB)
Summary
| Description |
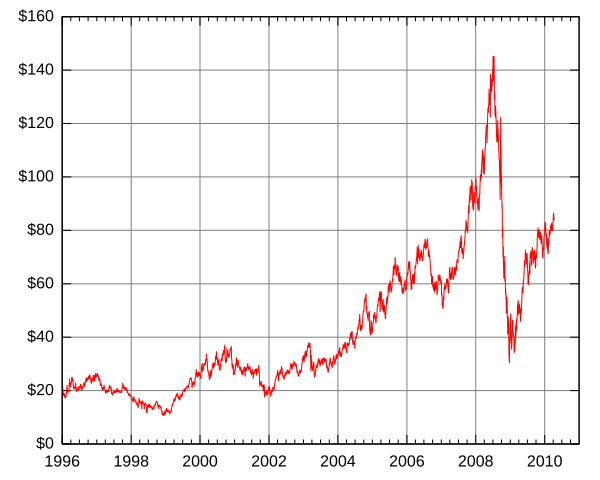
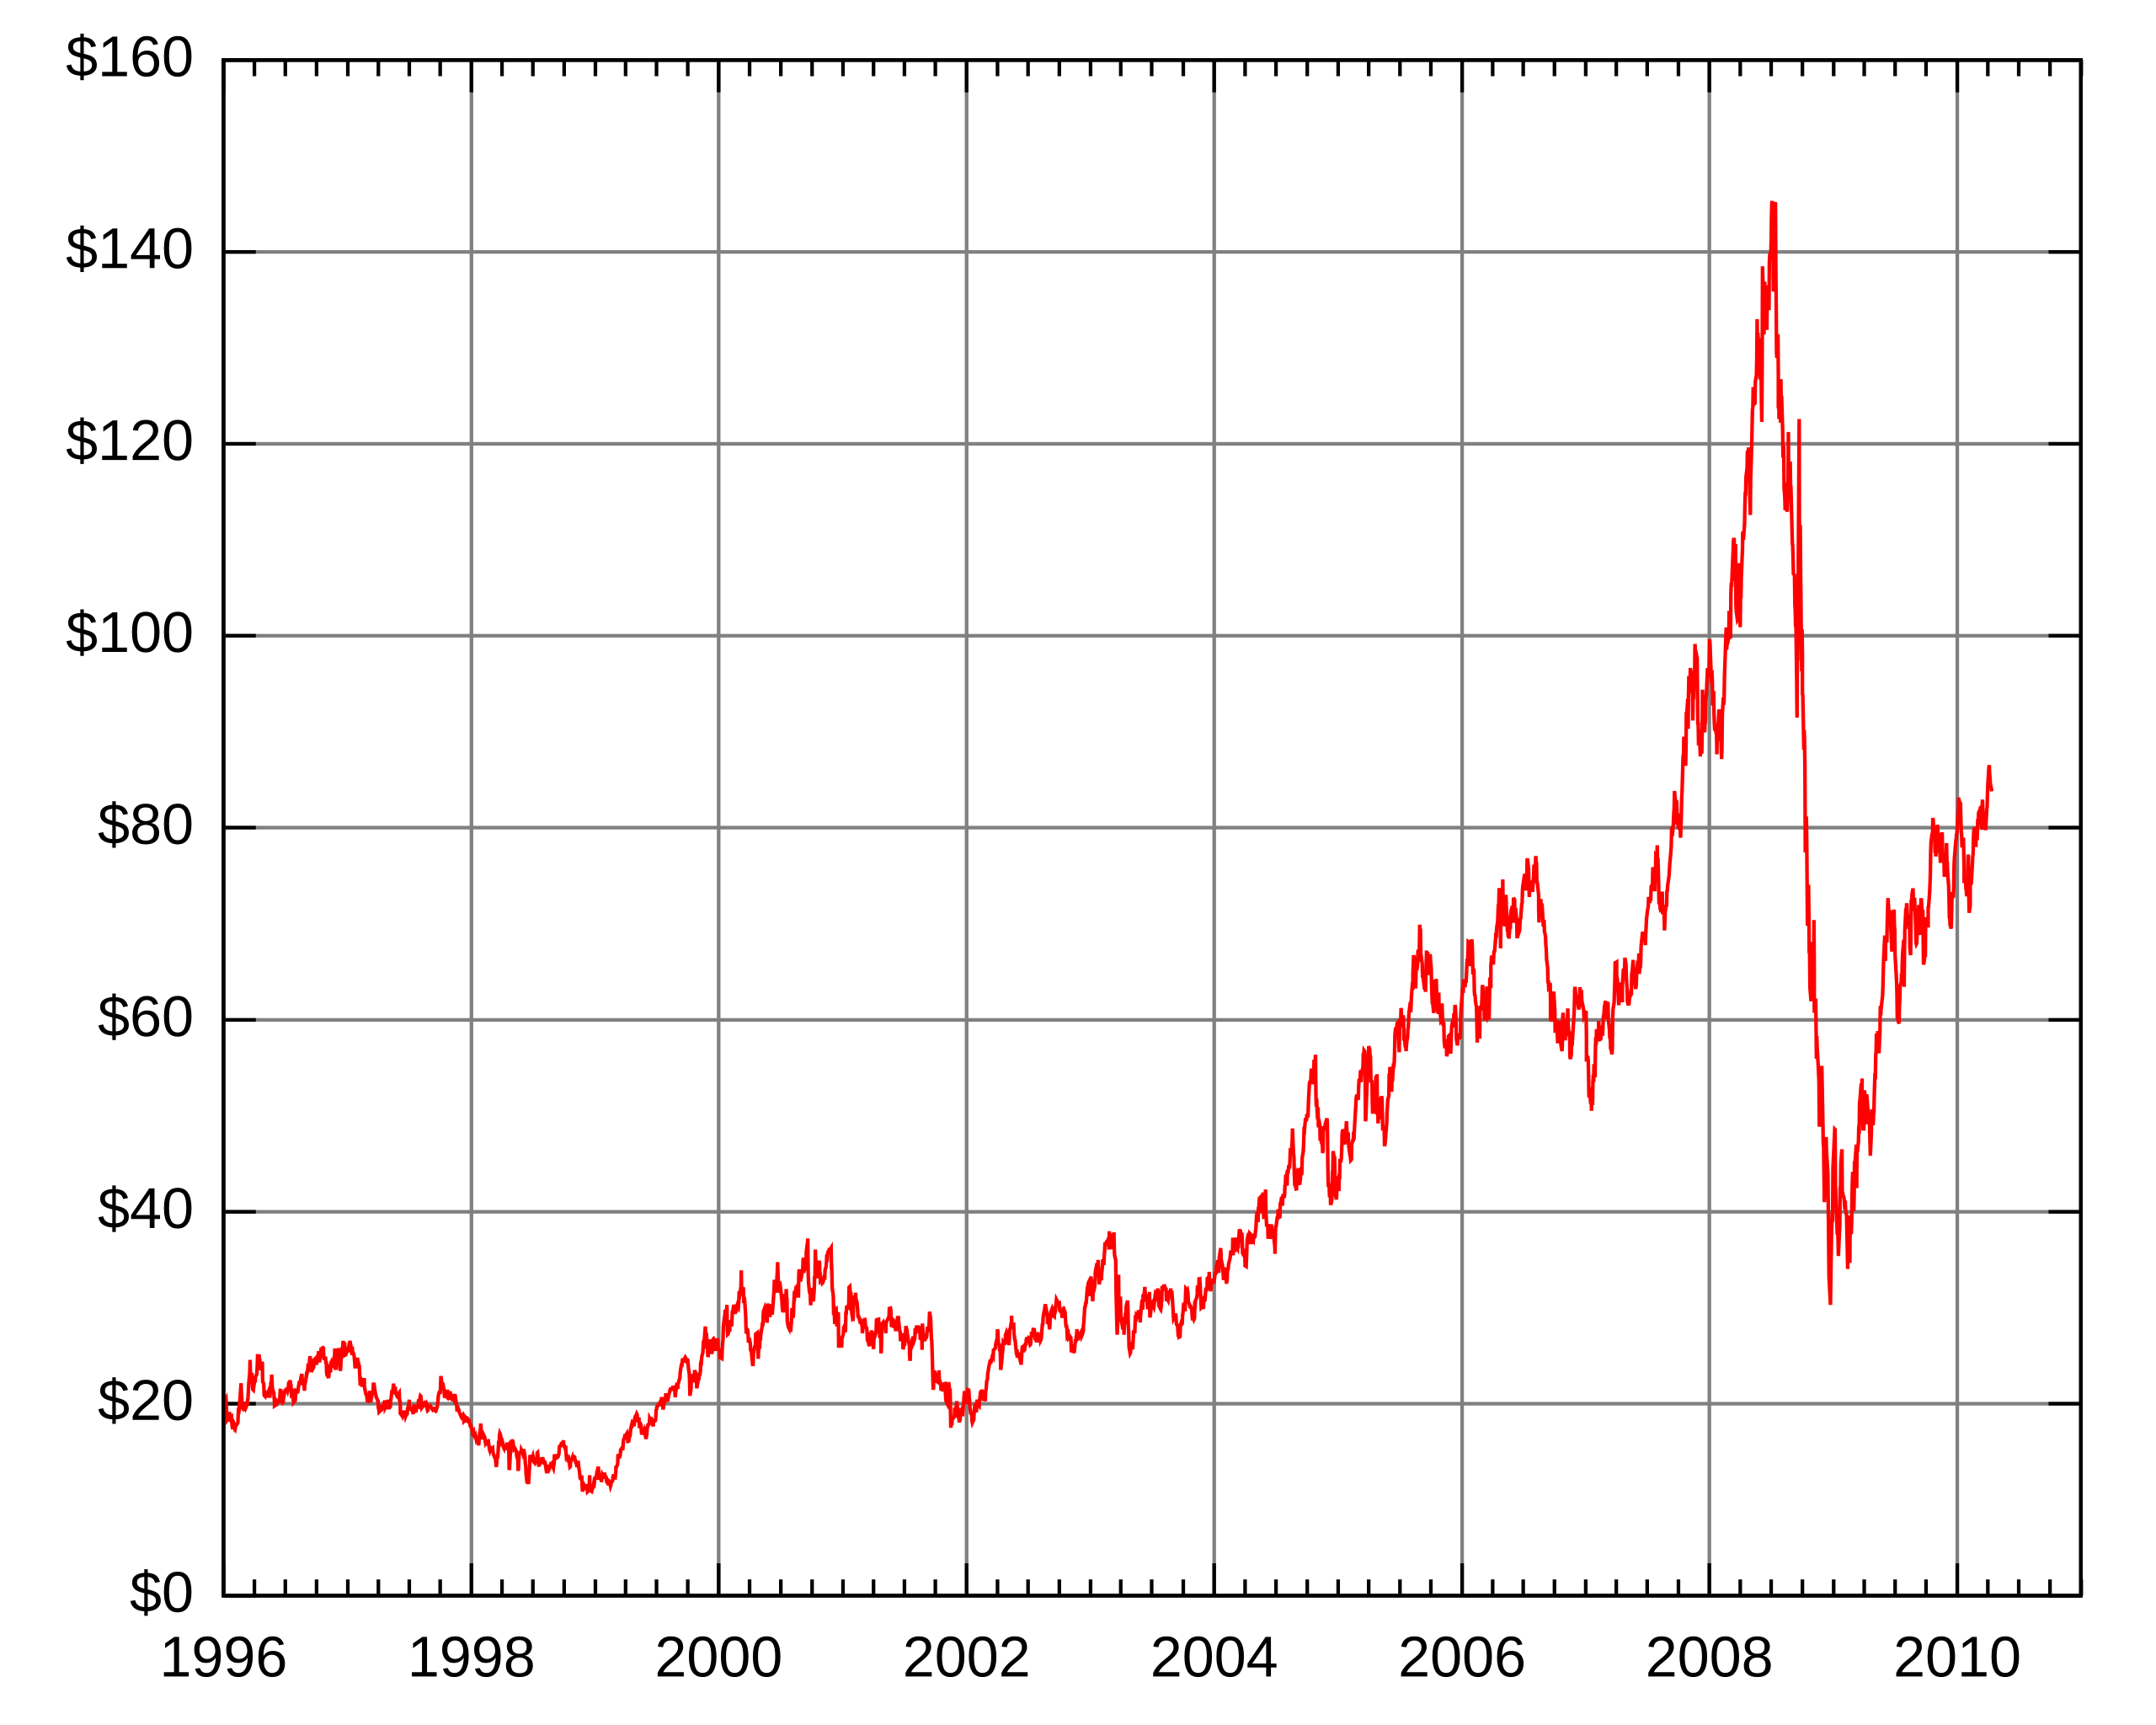
English: Updated version of Image:WTI price 96 09.PNG
Petroleum prices or oil prices through recent history. Price of oil. Oil price increase. Oil price runup. Oil price crash. Y-axis: Dollars per barrel for NYMEX sweet light crude WTI X-axis: year http://en.wikipedia.org/wiki/File:Oil_Prices_Medium_Term.png Ten-day moving average of prices of NYMEX Light Sweet Crude. Data from the Energy Information Administration (EIA). Prices are nominal (not adjusted for inflation). http://tonto.eia.doe.gov/dnav/pet/pet_pri_spt_s1_d.htm |
| Date | |
| Source | Own work |
| Author | Theanphibian |
| Other versions |
|
| SVG development |

Licensing
| I, the copyright holder of this work, release this work into the public domain. This applies worldwide. In some countries this may not be legally possible; if so: I grant anyone the right to use this work for any purpose, without any conditions, unless such conditions are required by law. |
File history
Click on a date/time to view the file as it appeared at that time.
| Date/Time | Thumbnail | Dimensions | User | Comment | |
|---|---|---|---|---|---|
| current | 15:53, 20 April 2010 | | 600 × 480 (60 KB) | imagescommonswiki>Theanphibian | Added "$" symbol |
File usage
The following file is a duplicate of this file (more details):
- File:WTI price 96 09.svg from Wikimedia Commons
There are no pages that use this file.